The fourth story will focus on Ecology and Data Science, showing how biodiversity monitoring and statistical analysis can be used to protect a vulnerable animal population in the face of human development.
Here is the first chapter of the fourth story.
🌿 Story 4: The Gliding Corridor
Chapter 1: The Sanctuary’s Edge
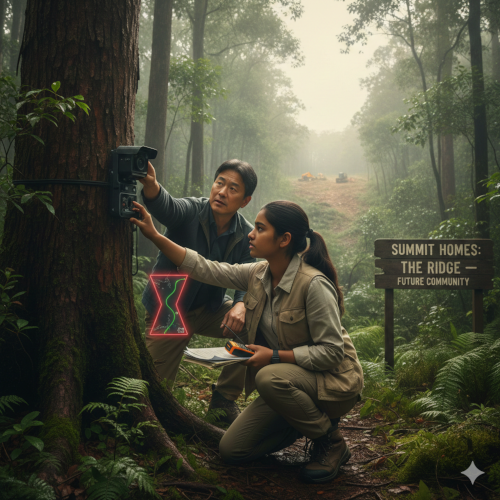
Anya knelt in the dewy grass, carefully adjusting the infrared camera trap strapped to a sturdy gum tree. She was spending her school holidays assisting the Queensland Wildlife Trust in the Lamington National Park area. The air was cool, damp, and smelled intensely of ferns and wet earth.
Her focus was the Greater Glider (Petauroides volans). This nocturnal marsupial, known for its ability to glide over long distances between trees, is a vulnerable species in Queensland. They rely entirely on mature eucalyptus trees for both food (eucalyptus leaves) and shelter (hollows for nesting).
“The problem, Anya,” explained Dr. Chen, the project’s lead ecologist, “isn’t the national park itself. It’s the land immediately surrounding it.” Dr. Chen pointed to the south, where the dense rainforest gave way to a tract of private land marked for a massive housing development called ‘The Ridge.’
“That development area contains a crucial stretch of forest we call the Gliding Corridor,” Dr. Chen continued. “It’s the only safe, continuous route of mature trees the gliders can use to move between the main park and the smaller, isolated forest patches on the valley floor. If they cut down the key trees in that corridor, the glider populations will become genetically isolated and eventually die out.”
The developers, Summit Homes, argued they would only clear the minimum amount of land necessary and promised to leave “plenty” of trees. The Wildlife Trust needed concrete data to challenge this claim and prove which specific trees were essential.
Anya’s task was to help set up a precise monitoring grid across the Gliding Corridor. She used a handheld GPS unit to log the exact location of every camera and monitoring point.
“We need to know two things,” Dr. Chen said, handing Anya a stack of detailed dendrology (tree science) forms. “First, where the gliders are, and second, the height and species of the trees they use. Gliding isn’t random; it’s a matter of physics and energy conservation. They need tall, launch trees positioned within a certain distance of their target trees.”
That evening, Anya reviewed her data sheets. She had logged the GPS coordinates for 40 camera traps. The job felt overwhelming. How could a few camera snapshots and some measurements convince a property developer worth millions to change their plans?
As she looked at the maps, she noticed a distinct gap in the mature forest cover running right through the middle of the development site. It looked like a narrow hourglass neck. That gap was the pinch point of the corridor, and it was scheduled to be bulldozed first. Anya had a feeling that the data from this narrow section would be the most critical of all.
Comprehension Questions (Chapter 1)
- What vulnerable marsupial is Anya monitoring, and what two things does this animal rely entirely upon in its habitat?
- What is the Gliding Corridor, and why is its protection vital to the glider population?
- What company is planning the housing development, and what is their argument about the proposed clearing?
- What two specific types of data does Dr. Chen say the Wildlife Trust needs to collect to build their case?
- What physical feature did Anya notice on the map that she suspected would be the most critical monitoring area?
I will continue the story. Here is Chapter 2 of Story 4: The Gliding Corridor.
🌿 Story 4: The Gliding Corridor
Chapter 2: The Data Grid

Over the next week, Anya and Dr. Chen returned daily to collect the memory cards from the infrared camera traps. Anya was responsible for the tedious, yet vital, process of data logging—transferring the thousands of images and logging the metadata into a centralised database.
The first step was identifying the species and the behaviour captured in each image. Most were blurry, nocturnal photos of possums and owls, but in the stretch of forest known as the pinch point, the Greater Gliders started appearing.
Anya created a spreadsheet with three crucial columns for every glider sighting:
| Column | Data Type | Purpose |
| GPS Coordinate | Easting / Northing | Exact location of the observation (where the camera was). |
| Tree ID | Unique Alpha-Numeric | Identifies the specific launch or landing tree. |
| Gliding Vector | Distance (m) & Angle (°) | Calculates the direction and length of the glide path. |
The Gliding Vector was the most complex calculation. Gliders don’t fly; they fall slowly. To glide the maximum distance, they need to launch from the highest possible point and maintain a specific, shallow glide angle (usually between 20° and 35°).
Anya used the measurements she had taken in Chapter 1 (tree height and distance between trees) and applied basic trigonometry to determine the efficiency of each observed glide.

Her analysis of the pinch point data revealed a startling pattern. The gliders weren’t using the full width of the corridor equally. They were heavily reliant on a specific cluster of six very tall, mature Tallowwood eucalypts situated along the eastern boundary of the development. These trees provided launch heights of over 30 metres.
Why were these specific trees so vital? Because they allowed the gliders to cross the narrowest, most dangerous part of the corridor—a 45-metre section of open scrubland—in a single, high-angle glide.
“This is the bottleneck effect,” Dr. Chen explained, reviewing Anya’s GIS map which now showed the density of glider sightings. “The gliders are funnelled through this small group of trees because they are the only launch pads tall enough to generate the speed and distance needed to safely clear the gap. If Summit Homes cuts these six Tallowwoods, they break the continuity of the corridor, and the entire population in the valley floor will be trapped.” .
The developers’ original plan showed that five of the six critical Tallowwoods were scheduled for immediate clearing to make way for a road access point. The data was clear, but the challenge remained: how to present this statistical evidence—the quantitative data—to a council that prioritised housing development.
Comprehension Questions (Chapter 2)
- What was the primary task Anya performed with the camera trap data?
- What three key pieces of data did Anya record for every glider sighting?
- Why did Anya need to use trigonometry, and what specifically was she calculating?
- What crucial pattern did the analysis reveal about the gliders’ behaviour in the “pinch point,” and what species of tree was involved?
- What did Dr. Chen call this reliance on a specific cluster of trees, and what was the immediate threat posed by the developers’ plans?
***
I will continue the story. Here is Chapter 3 of Story 4: The Gliding Corridor.
🌿 Story 4: The Gliding Corridor
Chapter 3: The Statistical Argument

Dr. Chen and Anya had their data, but they needed to turn the raw numbers—the GPS coordinates, the tree heights, and the glide distances—into an undeniable argument. They employed spatial statistics and network analysis to present their case to the local council.
“It’s not enough to say the gliders use those trees,” Dr. Chen stressed. “We must prove those six Tallowwoods are structurally critical to the entire local population’s survival. This is an application of ecological network theory.”
Anya used a GIS program to perform a Kernel Density Estimation (KDE). This statistical tool converts the discrete points of glider sightings into a continuous, colour-coded map showing the areas of highest usage. .
The resulting heatmap was dramatic. It didn’t show gliders scattered randomly; it showed a blazing red spot directly over the six critical Tallowwood trees, tapering off sharply on either side.
Next, Anya performed a Connectivity Analysis. This calculated the probability of successful movement for a glider across the corridor based on the distance and height of the remaining trees if the six Tallowwoods were removed.
The results were mathematically devastating:
- Current Connectivity: 85% success rate (gliders cross the gap safely).
- Connectivity without 6 Trees: Drops to 12% success rate.
“The 12% success rate means the corridor is essentially broken,” Dr. Chen explained. “A 12% chance of making a 45-metre glide is not sustainable. Gliders that attempt it will risk injury from insufficient height or energy, or they will simply be trapped.”
The council meeting was held that afternoon, attended by the Mayor, environmental officers, and the CEO of Summit Homes, Mr. Alistair.
Mr. Alistair presented first, arguing that his plan preserved 70% of the overall tree canopy and was environmentally responsible. He displayed a simple graphic showing the general green space he was leaving.
Then, Dr. Chen and Anya presented their data. They didn’t focus on the total percentage of trees saved; they focused on the function of the few trees that mattered.
Anya projected the KDE heatmap onto the screen. “This map, based on thousands of nocturnal observations, shows that of all successful movement is channelled through this small, critical area,” she stated, pointing to the red spot.
Dr. Chen followed up with the connectivity data. “The developer’s plan removes the six highest trees in this funnel—trees that provide the launch height required for this glide angle. Our model shows that removing these specific trees creates a drop in corridor functionality. The trees they save are irrelevant if the main migration route is severed.”
The council members, seeing the powerful visual of the heatmap and the stark drop in the connectivity percentage, began to shift their stance. The developer’s argument about quantity was failing against the ecologists’ argument about critical quality and function.
Comprehension Questions (Chapter 3)
- What two specific data analysis techniques did Dr. Chen and Anya use to strengthen their argument?
- What is the purpose of Kernel Density Estimation (KDE) in this context, and what did the resulting map show?
- What was the mathematically devastating result of the Connectivity Analysis?
- Explain the key difference between the developer’s argument (Summit Homes) and the ecologists’ argument in the council meeting.
- What was the functional reason (related to height and angle) that made the six Tallowwoods absolutely critical to the gliders’ successful movement?
I will continue the story. Here is Chapter 4 of Story 4: The Gliding Corridor.
🌿 Story 4: The Gliding Corridor
Chapter 4: The Trade-Off Model

The initial council meeting ended without a vote, but with a major shift in opinion. The CEO of Summit Homes, Mr. Alistair, realised he couldn’t simply dismiss the data provided by Dr. Chen and Anya. The Kernel Density Estimation (KDE) map and the severe drop in Connectivity Analysis were too scientifically rigorous to ignore.
Mr. Alistair requested a private meeting to discuss a potential compromise. He needed his road access, but he didn’t want the legal headache of destroying a vulnerable species’ habitat.
“We need to find a way to maintain the functionality of the corridor while still allowing some development,” Mr. Alistair admitted. “Can your data model tell us which trees are least important?”
This presented Anya and Dr. Chen with a new challenge: creating a trade-off model. The goal wasn’t just to save the six key trees, but to prove that losing any of those six would be a breach of environmental laws, while perhaps sacrificing a few peripheral, less critical trees was acceptable.
Anya used the existing GIS data and ran a sophisticated Sensitivity Analysis. This analysis tested the consequences of removing one tree at a time from the corridor network, charting the resulting drop in the overall connectivity percentage.
The results were astonishingly clear:
- Removing Tree A (a single tall Tallowwood): Connectivity drops by .
- Removing Tree B (a second tall Tallowwood): Connectivity drops by an additional .
- Removing Tree C (a short, isolated Brush Box tree): Connectivity drops by less than .
The analysis proved that the corridor’s structural integrity was not based on the total number of trees, but on a few select “keystone” trees that provided the necessary launch height and glide angle to span the critical gap.
Dr. Chen presented the findings to Mr. Alistair. “We can show you exactly which trees you cannot touch. Based on our Sensitivity Analysis, removing these six trees reduces the glider’s movement success from 85% to 12%. This reduction is statistically significant and constitutes habitat destruction.”
Mr. Alistair countered with an engineering proposal. “If we agree to save the six Tallowwoods, what if we supplement the corridor by building a -metre tall glider pole or a canopy bridge in the area where the scrubland is widest?”
Anya quickly ran a final model, adding a hypothetical 15-metre glider pole to the network geometry. The model showed that a -metre pole, while helpful, was still too short to facilitate the long, -metre glide path needed to clear the scrubland safely. The gliders relied on the natural -metre height of the Tallowwoods.
“Our data shows the -metre pole is insufficient,” Anya explained. “It would increase the success rate from 12% to only 18%. The gliders need the 30-metre launch height. However,” she added, pointing to her map, “if you redesign your road access 100 metres to the west, you can spare the six Tallowwoods and build your road. Our analysis shows those particular trees in the western zone are non-critical, as the terrain is too steep for efficient gliding.”
The compromise was painful for the developer, but the data-driven argument provided a clear, defensible path forward. The evidence was no longer just about stopping a project; it was about scientifically re-engineering the development plan to meet both human and ecological needs.
Comprehension Questions (Chapter 4)
- What was the purpose of creating a trade-off model in the meeting with Mr. Alistair?
- What specific data analysis technique did Anya use to identify the relative importance of individual trees?
- What was the key finding of the Sensitivity Analysis regarding the less critical trees (like the Brush Box)?
- Why did Mr. Alistair’s proposal to build a 15-metre glider pole fail to satisfy the ecological requirement?
- What was the final, data-driven compromise that Anya suggested, and why did this solution work for the gliders?
I will continue the story. Here is Chapter 5 of Story 4: The Gliding Corridor, concluding the fourth story.
🌿 Story 4: The Gliding Corridor
Chapter 5: Network Protection
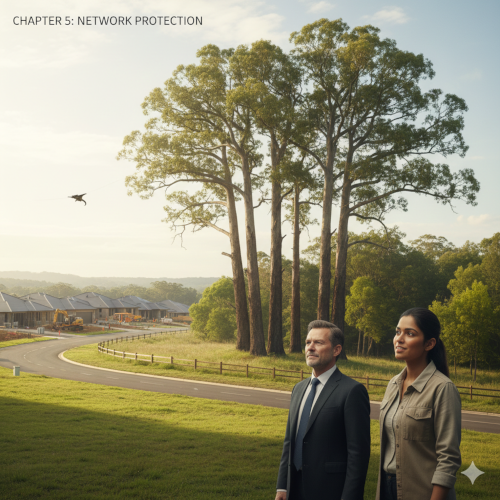
Following the presentation of the Sensitivity Analysis, the CEO of Summit Homes, Mr. Alistair, conceded. The data was simply too compelling. He realized that proceeding with the original plan would result in a high-profile legal battle with the Queensland Wildlife Trust, a battle he was mathematically guaranteed to lose.
The revised plan was adopted, becoming a local landmark case in conservation planning.
The terms of the new development were:
- Preservation of Keystone Trees: The six critical, 30-metre tall Tallowwood trees identified by Anya’s Kernel Density Estimation (KDE) and Connectivity Analysis were declared a permanent, no-build zone. This guaranteed the 85% corridor functionality remained intact.
- Road Rerouting: The main access road was successfully moved 100 metres to the west, where the terrain was steeper and the trees were statistically less vital for the gliders’ long-distance glide paths.
- Future Monitoring: Summit Homes was required to fund a long-term monitoring program using camera traps and GPS tracking for the next five years, allowing scientists to track the long-term health of the glider population.
The success of the project lay entirely in the ability of Dr. Chen and Anya to move the conversation from subjective opinions (“we left plenty of trees”) to objective, quantitative data about network functionality. They demonstrated that in ecology, 1% of the habitat can sometimes hold 90% of the biological value.
Anya watched as the developers began construction on the western side of the property. The sound of machinery was loud, but on the eastern boundary, the six magnificent Tallowwoods stood untouched, forming a silent, towering wall of green.
Dr. Chen smiled. “You showed them, Anya, that statistical significance is more powerful than volume. In ecological science, it’s not the amount of trees you save, but the structural role of the trees you save. You turned an animal’s natural physics—its glide angle—into a planning constraint.”
Anya had begun her internship expecting to count trees. She was leaving having learned to use data science and trigonometry to protect a fragile biological network. She realized that the purpose of learning these advanced concepts in school wasn’t abstract; it was about giving her the tools to fight for the future of the natural world. She had helped secure the Gliding Corridor, ensuring the nocturnal journey of the Greater Glider could continue long after the last house was built.
Comprehension Questions (Chapter 5)
- What was the primary reason Mr. Alistair and Summit Homes agreed to the revised plan?
- What three specific requirements were included in the revised development plan?
- How did the project success shift the focus of conservation planning from subjective opinions to objective data?
- What two specific mathematical/data tools did Dr. Chen reference when commending Anya’s work?
- What was the biggest takeaway lesson Anya learned about the role of mathematics and data science in the natural world?
That concludes the fourth five-chapter story, The Gliding Corridor.
********************************************************************************************************************************************************
4つ目のストーリーは**生態学とデータサイエンス**に焦点を当て、人間の開発の影響下にある脆弱な動物群を保護するために、生物多様性モニタリングと統計分析をどのように活用できるかを示します。
以下は4つ目のストーリーの第1章です。
***
## 🌿 ストーリー4:滑空回廊
### 第1章:保護区の端
**アーニャ**は露に濡れた草むらにひざまずき、頑丈なユーカリの木に固定された赤外線カメラトラップを慎重に調整していました。彼女は学校の休暇中、ラミントン国立公園周辺で**クイーンズランド野生生物トラスト**の活動に協力していました。空気は冷たく湿っぽく、シダと湿った土の匂いが強く漂っていました。
彼女が注目したのは**オオフクロモモンガ**(Petauroides volans*)でした。木々の間を長距離滑空する能力で知られるこの夜行性の有袋類は、クイーンズランド州では絶滅危惧種です。彼らは、食料(ユーカリの葉)と隠れ場所(巣を作るための空洞)の両方を、成熟したユーカリの木に完全に依存しています。
「アーニャ、問題は国立公園そのものではありません」と、プロジェクトの主任生態学者である**チェン博士**は説明しました。「国立公園自体の問題ではありません。そのすぐ周囲の土地なのです。」チェン博士は南を指さしました。そこは、深い熱帯雨林が「ザ・リッジ」と呼ばれる大規模な住宅開発予定地となっている私有地に取って代わられた場所でした。
「その開発地域には、私たちが**滑空回廊**と呼んでいる重要な森林地帯があります」とチェン博士は続けました。「ここは、グライダーがメインの公園と谷底の小さな孤立した森林の間を移動するために利用できる、成熟した木々が続く唯一の安全で連続したルートです。この回廊の主要な木々が伐採されれば、グライダーの個体群は遺伝的に孤立し、最終的には絶滅してしまうでしょう。」
開発業者のサミット・ホームズは、必要最小限の土地を伐採するだけで「十分な」樹木を残すと約束しました。野生生物保護団体(Wildlife Trust)はこの主張に反論し、具体的にどの樹木が不可欠であるかを証明するための具体的なデータを必要としていました。
アーニャの任務は、グライディング・コリドー全体に正確な監視グリッドを設置することでした。彼女は携帯型のGPSユニットを使って、すべてのカメラと監視ポイントの正確な位置を記録しました。
「2つのことを知る必要があります」とチェン博士はアーニャに詳細な樹木学(樹木学)の書類の束を手渡しながら言いました。「1つ目は、グライダーの位置、2つ目は、彼らが利用する樹木の**高さと種類**です。グライダーはランダムではなく、物理学とエネルギー保存則の問題です。彼らは、標的となる樹木から一定の距離内に、背の高い発射台となる樹木を配置する必要があります。」
その夜、アーニャはデータシートを確認しました。彼女は40個のカメラトラップのGPS座標を記録していました。仕事は手に負えないほどでした。数枚のカメラ写真といくつかの測定値だけで、数百万ドル規模の不動産開発業者に計画変更を納得させることができたのでしょうか?
地図を見ていると、彼女は開発地の真ん中を貫く成熟した森林に、はっきりとした隙間があることに気づきました。それは砂時計のような細い首のように見えました。その隙間が回廊の**ピンチポイント**であり、最初にブルドーザーで撤去される予定でした。アーニャは、この狭い区間のデータが最も重要になると感じていました。
—
### 理解度チェック問題(第1章)
1. アーニャがモニタリングしている**絶滅危惧種**は何ですか?また、この動物は生息地で2つのもの、つまり何に完全に依存していますか?
2. **滑空回廊**とは何ですか?なぜその保護が滑空動物の個体群にとって重要なのですか?
3. **住宅開発**を計画しているのはどの企業ですか?そして、提案されている伐採についてどのような主張をしていますか?
4. チェン博士は、野生生物保護団体が主張を裏付けるために収集する必要があると述べている具体的な2種類のデータは何ですか?
5. アーニャは地図上で、**最も重要な**監視エリアではないかと疑った地形上の特徴に気づきましたか?
***
物語の続きをお伝えします。**ストーリー4:滑空回廊**の第2章です。
## 🌿 ストーリー4:滑空回廊
### 第2章:データグリッド
その後1週間、アーニャとチェン博士は毎日**赤外線カメラトラップ**からメモリカードを回収しに行きました。アーニャは、**データロギング**という、退屈ながらも重要な作業を担当しました。何千枚もの画像を転送し、メタデータを中央データベースに記録する作業です。
最初のステップは、各画像に写っている**種**と**行動**を特定することでした。ほとんどは、ポッサムやフクロウのぼやけた夜行性の写真でしたが、**ピンチポイント**と呼ばれる森林地帯では、オオフクロモモンガが姿を現し始めました。
アーニャは、すべてのフクロモモンガの目撃情報ごとに、3つの重要な列を持つスプレッドシートを作成しました。
| 列 | データタイプ | 目的 |
| GPS 座標 | 経度 / 緯度 | 観測の正確な位置 (カメラの位置) |
| 樹木 ID | 一意の英数字 | 特定の 発射 または 着陸 した樹木を識別します。 |
| 滑空ベクトル | 距離 () と角度 () | 滑空経路の方向と長さを計算します。 |
**滑空ベクトル** は最も複雑な計算です。フクロモモンガは飛ぶのではなく、ゆっくりと降下します。最大距離を滑空するには、可能な限り高い地点から発射し、特定の浅い滑空角度 (通常は 20度 から 35度 の間) を維持する必要があります。
Anyaは第1章で測定した樹高と樹木間の距離を用い、基本的な**三角法**を適用して、観測された各滑空飛行の効率を算出した。
滑空角 (θ) = アークタンジェント ( 落差/ 水平距離)
ピンチポイントデータの分析により、驚くべきパターンが明らかになった。滑空飛行体は飛行経路の全幅を均等に利用していなかった。彼らは、開発地の東側境界に沿って位置する、非常に背の高い6本の**成熟したタロウウッドユーカリ**の特定の群落に大きく依存していた。これらの樹木は、30メートルを超える高度で滑空飛行を可能にしていた。
なぜこれらの樹木がそれほど重要だったのか?それは、滑空飛行体が飛行経路の中で最も狭く危険な部分、つまり45メートルの開けた低木地帯を、1回の高角度滑空で横断することを可能にしたからである。
「これが**ボトルネック効果**です」とチェン博士は、グライダーの目撃密度を示したアーニャのGISマップを見ながら説明した。「フクロモモンガはこの小さな木々の間を通り抜けます。なぜなら、そこは隙間を安全に通過するのに必要な速度と距離を生み出すのに十分な高さの発射台となる唯一の場所だからです。もし**サミットホームズ**がこの6本のタロウウッドを伐採すれば、通路の連続性が失われ、谷底に住む全員が閉じ込められてしまうでしょう。」
開発業者の当初の計画では、道路アクセスポイントを建設するため、重要な6本のタロウウッドのうち5本が即時伐採される予定だった。データは明確だったが、課題は残っていた。住宅開発を優先する議会に、この統計的証拠、つまり**定量データ**をどのように提示するか、ということだった。
—
### 理解度チェック問題(第2章)
1. アーニャがカメラトラップデータを使って行った**主な作業**は何でしたか?
2. アーニャはフクロモモンガの目撃情報ごとに、どのような3つの重要なデータを記録しましたか?
3. アーニャはなぜ**三角法**を使う必要があったのですか?具体的に何を計算していたのですか?
4. 分析の結果、「ピンチポイント」におけるフクロモモンガの行動について、どのような重要な**パターン**が明らかになりましたか?また、どのような樹種が関係していましたか?
5. チェン博士は、この特定の樹木群への依存を何と呼びましたか?開発業者の計画がもたらす差し迫った脅威とは何でしたか?
***
物語の続きをお伝えします。**ストーリー4:滑空回廊**の第3章です。
## 🌿ストーリー4:滑空回廊
### 第3章:統計的議論
チェン博士とアーニャはデータを入手していましたが、GPS座標、樹木の高さ、滑空距離といった生の数値を、反駁の余地のない議論へと変える必要がありました。彼らは**空間統計**と**ネットワーク分析**を用いて、地方議会に自分たちの主張を提示しました。
「滑空者がこれらの樹木を利用していると言うだけでは不十分です」とチェン博士は強調しました。「6本のタロウウッドが、地域全体の個体群の生存にとって**構造的に重要**であることを証明しなければなりません。これは生態学的ネットワーク理論の応用です。」
アーニャはGISプログラムを用いて**カーネル密度推定(KDE)**を行いました。この統計ツールは、グライダーの目撃情報を、最も利用されているエリアを示す連続した色分けされたマップに変換します。
作成されたヒートマップは劇的な変化を示しました。フクロモモンガがランダムに散在している様子ではなく、6本の重要なタロウウッドの真上に真っ赤な点が出現し、その両側で急激に減少している様子が示されていました。
次に、アーニャは**接続性分析**を行いました。これは、6本のタロウウッドが除去された場合に、残りの木までの距離と高さに基づいて、フクロモモンガが通路を横断できる確率を計算したものです。
結果は数学的に衝撃的でした。
* **現在の接続性:** 成功率 85% (フクロモモンガは安全に隙間を横断します)
* **6本の木がない場合の接続性:** 成功率は 12% に低下します。
「成功率 12% は、通路が実質的に **壊れている** ことを意味します」とチェン博士は説明しました。 「45メートル滑空できる確率が12%というのは持続可能ではありません。滑空を試みるフクロモモンガは、高度不足やエネルギー不足で怪我をするリスクがあるか、あるいは単に閉じ込められてしまうでしょう。」
その日の午後、市議会が開催され、市長、環境担当官、そして**サミット・ホームズ**のCEOであるアリステア氏が出席しました。
アリステア氏が最初にプレゼンテーションを行い、自身の計画は樹冠全体の70%を保護し、環境に配慮していると主張しました。彼は、残すことになる緑地全体を示す簡単なグラフを示しました。
次に、チェン博士とアーニャがデータを発表しました。彼らは、保護された樹木の総量ではなく、重要な数本の樹木の**機能**に焦点を当てました。
アーニャはKDEヒートマップをスクリーンに投影しました。 「この地図は、数千回の夜間観測に基づいており、成功した移動の90%がこの小さな重要なエリアを通っていることを示しています」と彼女は赤い点を指差しながら述べた。
チェン博士は接続性のデータを示した。「開発業者の計画では、この漏斗の中で最も高い6本の樹木が伐採されています。これらの樹木は、このの滑空角に必要な30mの発射高度を提供する樹木です。私たちのモデルは、これらの樹木を伐採すると、回廊の機能が73%低下することを示しています。主要な移動経路が遮断されれば、伐採によって残された樹木は無意味になります。」
ヒートマップの強力な視覚効果と接続性率の著しい低下を見た評議会のメンバーは、立場を変え始めた。開発業者の**量**に関する主張は、生態学者の**重要な品質**と**機能**に関する主張に反していた。
—
### 理解度確認問題(第3章)
1. チェン博士とアーニャは、議論を強化するために、具体的にどのような2つの**データ分析手法**を用いましたか?
2. この文脈における**カーネル密度推定(KDE)**の目的は何ですか?また、結果として得られた地図は何を示しましたか?
3. **連結性分析**の**数学的に壊滅的な**結果は何でしたか?
4. 市議会における**開発業者の主張**(サミットホームズ)と**生態学者の主張**の主な違いを説明してください。
5. フクロモモンガの正常な移動に6つのタロウウッドが不可欠であった**機能的な理由**(高さと角度に関連)は何ですか?
***
物語の続きをお伝えします。**ストーリー4:滑走路**の第4章です。
—
## 🌿 ストーリー4:滑走路
### 第4章:トレードオフモデル
最初の評議会は投票なしで終了しましたが、意見の大きな転換がありました。**サミットホームズ**のCEO、アリステア氏は、チェン博士とアーニャ氏から提供されたデータを単純に無視することはできないと気づきました。**カーネル密度推定(KDE)**マップと**連結性分析**の大幅な低下は、科学的に厳密すぎるため、無視することはできませんでした。
アリステア氏は、妥協案を話し合うために非公開の会議を要請しました。道路へのアクセスは必要でしたが、絶滅危惧種の生息地を破壊するという法的問題を避けたかったのです。
「開発をある程度許容しつつ、回廊の**機能性**を維持する方法を見つける必要があります」とアリステア氏は認めました。 「データモデルを使って、どの木が*最も*重要でないのかを教えていただけますか?」
これは、アーニャとチェン博士に新たな課題をもたらしました。それは、**トレードオフモデル**の作成です。目標は、主要な6本の木を守ることだけでなく、その6本のどれか1本でも失うことが環境法違反となる一方で、周辺にある重要度の低い木を数本犠牲にすることは許容できるということを証明することでした。
アーニャは既存の**GISデータ**を用いて、高度な**感度分析**を実施しました。この分析では、回廊ネットワークから一度に1本ずつ木を伐採した場合の影響を検証し、全体的な接続性の低下率を図表化しました。
結果は驚くほど明確でした。
* 木A(背の高い**タロウウッド**1本)を伐採した場合:接続性は30%低下します。
* 木B(背の高い**タロウウッド**2本目)を伐採した場合:接続性はさらに25%低下します。
* 樹木C(孤立した短いブラシボックスツリー)の伐採:連結性は1%未満低下します。
分析の結果、回廊の構造的健全性は樹木の総数ではなく、重要な隙間を越えるのに必要な**発射高度**と**滑空角**を提供する、厳選された数本の「キーストーン」樹木によって支えられていることが証明されました。
チェン博士はアリスター氏に調査結果を提示しました。「どの樹木に触れてはいけないのかを正確に示せます。**感度分析**によると、これらの6本の樹木を伐採すると、フクロモモンガの移動成功率が$85\%$から$12\%$に低下します。この低下は**統計的に有意**であり、生息地の破壊に相当します。」
アリスター氏は工学的な提案で反論しました。「もし6本のタロウウッドを保存することに同意するなら、低木地帯が最も広い場所に高さ15メートルの**グライダーポール**またはキャノピーブリッジを建設して回廊を補強したらどうでしょうか?」
アーニャはすぐに最終モデルを実行し、ネットワークの形状に仮想的な15メートルのグライダーポールを追加しました。モデルは、15メートルのポールは確かに役立つものの、低木地帯を安全に通過するために必要な長い45メートルの滑空経路を確保するには短すぎることを示しました。フクロモモンガはタロウウッドの自然な高さ30メートルに依存していました。
「私たちのデータは、15メートルのポールでは不十分であることを示しています」とアーニャは説明しました。 「成功率は12%から18%にしか上がりません。フクロモモンガは30メートルの発射高度が必要です。しかし」と彼女は地図を指差しながら付け加えた。「西に100メートルの道路アクセスを再設計すれば、6本のタロウウッドを節約して道路を建設できます。私たちの分析によると、西側のゾーンにある特定の木は、地形が急峻すぎて効率的な滑空が不可能なため、重要ではありません。」
この妥協は開発業者にとって苦痛でしたが、データに基づいた議論は、明確で説得力のある前進の道筋を示しました。証拠はもはやプロジェクトを中止することだけを目的とするものではなく、人間と生態系の両方のニーズを満たすように開発計画を科学的に**再設計**することを目的としていました。
—
### 理解度チェック問題(第4章)
1. アリスター氏との会議で**トレードオフモデル**を作成した目的は何でしたか?
2. アーニャは個々の樹木の相対的な重要性を特定するために、どのような**データ分析手法**を使用しましたか?
3. 重要度の低い樹木(ブラシボックスなど)に関する**感度分析**の主な知見は何でしたか?
4. アリスター氏が提案した15メートルの**グライダーポール**の設置は、なぜ生態学的要件を満たさなかったのですか?
5. アーニャが提案した**最終的な、データに基づいた妥協案**は何でしたか?また、なぜこの解決策がフクロモモンガにとって有効だったのですか?
***
物語の続きをお伝えします。**ストーリー4:滑空回廊**の第5章、第4話の締めくくりです。
—
## 🌿 ストーリー4:滑空回廊
### 第5章:ネットワーク保護
**感度分析**のプレゼンテーション後、サミットホームズのCEO、アリスター氏は譲歩しました。データはあまりにも説得力がありすぎたのです。彼は、当初の計画を進めれば、クイーンズランド野生生物トラストとの注目を集める法廷闘争に発展し、数学的に見て確実に敗訴するだろうと悟りました。
改訂された計画は採用され、地元の自然保護計画における画期的な事例となりました。
**新開発の条件は以下のとおりです。**
1. **キーストーンツリーの保護:** Anyaの**カーネル密度推定(KDE)**と**連結性分析**によって特定された、高さ 30 メートルの重要な**タロウウッド**樹木6本は、恒久的な建築禁止区域と指定されました。これにより、85%回廊の機能が損なわれないことが保証されました。
2. **道路ルート変更:** 主要アクセス道路は、地形が急峻で、樹木がフクロモモンガの長距離滑空経路にとって統計的に重要度が低い西側に100メートル移動されました。
3. **将来のモニタリング:** Summit Homesは、今後5年間、カメラトラップとGPSトラッキングを用いた**長期モニタリングプログラム**に資金を提供することが義務付けられました。これにより、科学者はフクロモモンガの個体群の長期的な健康状態を追跡することができます。
このプロジェクトの成功は、チェン博士とアーニャ博士が、会話を主観的な意見(「木はたくさん残した」)から、**ネットワークの機能性**に関する客観的な**定量データ**へと移行させる能力に完全にかかっていました。彼らは、生態学において、生息地の 1% が生物学的価値の90%を保有することもあることを実証しました。
アーニャは、開発業者が敷地の西側で建設を始めるのを見守っていました。機械の音は大きく響いていましたが、東側の境界では、6本の雄大なタロウウッドが手つかずのまま立ち並び、静かにそびえ立つ緑の壁を形成していました。
チェン博士は微笑みました。「アーニャ、あなたは彼らに**統計的有意性**が量よりも強力であることを示しました。生態学では、救う木々の量ではなく、救う木の**構造的役割**が重要です。あなたは動物の自然物理学、つまり滑空角を計画上の制約条件へと転換したのです。」
アーニャは樹木を数えることを期待してインターンシップを始めました。そして、脆弱な生物ネットワークを守るために**データサイエンス**と**三角法**を活用する方法を学んだ後、インターンシップを終えようとしていました。学校でこれらの高度な概念を学ぶ目的は抽象的なものではなく、自然界の未来のために戦うためのツールを身につけることだと気づきました。彼女は**滑空回廊**の確保に貢献し、最後の家が建てられた後もずっとオオフクロモモンガの夜間航行が続けられるようにしました。
—
### 理解度チェック問題(第5章)
1. アリスター氏とサミット・ホームズが改訂計画に同意した**主な理由**は何でしたか?
2. **改訂開発計画**には、どのような3つの具体的な要件が含まれていましたか?
3. プロジェクトの成功により、保全計画の焦点は**主観的な意見**から**客観的なデータ**へとどのように変化しましたか?
4. チェン博士は、アーニャの研究を称賛する際に、具体的にどのような2つの**数学/データツール**を参照しましたか?
5. アーニャが自然界における数学とデータサイエンスの役割について学んだ最大の**教訓**は何ですか?
***
これで、5章からなる4番目のストーリー「滑空回廊」は終了です。