I will now provide Chapter 1 of the fifth story, “The Last Map of the Monsoon,” which explores themes of climate change, data interpretation, and cultural memory in the context of Queensland’s volatile weather.
Here is Chapter 1 of Story 5.
📚 Story 5: The Last Map of the Monsoon
🌧️ Chapter 1: The Predictable Anomaly

Amara, a high school student in Townsville, wasn’t interested in climate change theory; she was interested in the raw, messy data of the North Queensland monsoon. Her grandfather, a retired sugar cane farmer, had taught her that survival in the tropics depended on reading the sky better than the Bureau of Meteorology.
Amara’s project involved digitising 70 years of her family’s private weather journals, creating a longitudinal study of rainfall patterns, temperature swings, and the specific timing of the wet season’s arrival. She integrated this anecdotal data with public records, running the massive dataset through a basic machine learning model she had built on a repurposed gaming laptop, which she affectionately called ‘The Oracle.’
The official forecasts for the upcoming wet season were cautiously optimistic—predicting a mild, late-arriving monsoon. Amara’s family data, which tracked subtle indicators like the flowering cycles of the mango trees and the migratory timing of native birds, contradicted this.
Her family records showed that when the migratory birds arrived three weeks early (as they had this year), it always correlated with a sudden, violent shift in the monsoon pattern, resulting in both extreme drought and flash flooding.
On a warm afternoon in late November, Amara fed the final year of her grandfather’s observations into The Oracle. The program finished its run and spat out a single, unexpected output: a complex probability density function graphing the likelihood of rainfall.
The graph showed a dramatic bimodal distribution—two separated peaks—instead of the expected single bell curve. The first, lower peak predicted a severe dry spell lasting until mid-January. The second, much higher and sharper peak predicted an unprecedented, concentrated deluge beginning abruptly in late January.
Amara knew what a bimodal distribution meant: the weather wasn’t simply changing; it was becoming two different systems simultaneously—an extreme drought followed by an extreme flood. The Oracle wasn’t just predicting a severe weather event; it was predicting a collapse of the normal seasonal cycle. The Bureau of Meteorology’s models, built on decades of average data, were simply incapable of seeing this sharp deviation.
The only way to confirm her fears was to find the source of the hidden atmospheric pressure driving this bimodal shift. She needed the satellite data. Specifically, she needed the real-time atmospheric pressure maps of the Coral Sea that the national weather agencies rarely made public—the true, Last Map of the Monsoon that only the experts were using.
❓ Chapter 1 Comprehension Questions
- Vocabulary/Technical Terminology: What is a longitudinal study, and how did Amara’s combination of her family’s journals and public records create a powerful one?
- Recall: What was the specific traditional sign from her grandfather’s journals that contradicted the official weather forecasts?
- Analysis/Evaluation (Math/Science): Explain the significance of the bimodal distribution (two separate peaks) in Amara’s graph. What does this reveal about the nature of the upcoming wet season?
- Inference: Why were the Bureau of Meteorology’s models “incapable of seeing this sharp deviation,” according to the story?
Chapter 1 has established the data anomaly and the stakes.
I will now provide Chapter 2 of “The Last Map of the Monsoon.”
📚 Story 5: The Last Map of the Monsoon
📡 Chapter 2: The Latency of Data

Amara knew the official forecast models were constrained by data latency—the time delay between raw data collection and its public release. Her challenge was finding a real-time stream of the atmospheric pressure maps that would confirm the bimodal shift.
She decided to focus on the Himawari-8 Satellite, a critical Japanese-owned geostationary weather satellite that constantly monitors the Asia-Pacific region. The raw, high-resolution data from Himawari-8 is streamed in near real-time to the major meteorological agencies, providing the most accurate picture of atmospheric and sea surface pressure.
Amara needed access to a specific dataset: the Sea Level Pressure (SLP) anomaly maps. These maps highlight areas where the current atmospheric pressure significantly deviates from the long-term average. A strong, rapidly forming high-pressure system over the Pacific (which causes drought) followed by a deep, sudden low-pressure system near the coast (which causes flooding) would appear as a distinctive “positive-negative” dual anomaly on the SLP map.
She contacted her friend, Sam, a cybersecurity student at James Cook University. Sam was known for his ability to navigate complex digital security systems. Amara wasn’t asking him to breach a firewall; she was asking him to find a known, sanctioned data mirror—a low-security server used by research institutions to house publicly funded data that was simply too dense for general public access.
Sam found it: a mirror server hosted by a small, university-affiliated oceanographic research centre in Western Australia. The server was slow, unadvertised, and contained the raw, 10-minute resolution SLP maps from Himawari-8, delayed by only four hours—a significant improvement over the 24-hour delay in the public BOM reports.
After an agonizing download, Amara loaded the high-resolution SLP maps into The Oracle. The data immediately confirmed her fears.
The map showed a colossal Positive Pressure Anomaly (PPA)—a vast region of static, high atmospheric pressure—parked stubbornly in the Coral Sea. This PPA was acting like a wall, blocking the normal eastward movement of tropical moisture and guaranteeing the severe drought in the coming weeks.
However, on the western edge of the Coral Sea, right against the Queensland coastline, the map showed a Negative Pressure Anomaly (NPA)—a small, rapidly deepening low-pressure area. The PPA was compressing all the remaining atmospheric energy into this small NPA, creating a colossal pressure differential. This meant that when the PPA finally broke down, the compressed energy would release in a massive, concentrated surge of rainfall, exactly matching the second, sharper peak in Amara’s bimodal distribution.
The Oracle calculated the predicted date of the breakdown: January 21st. Amara had the Last Map of the Monsoon—a map that predicted not a mild wet season, but a climate catastrophe compressed into a two-week window. She now had to figure out how to force a major government agency to believe her high school project over their decades of established modeling.
❓ Chapter 2 Comprehension Questions
- Vocabulary/Technical Terminology: What is data latency, and how did Sam’s ability to find a “data mirror” help Amara overcome this problem?
- Recall: What specific satellite was Amara interested in, and what type of pressure map did she need to access?
- Analysis/Evaluation (Science): Explain the significance of the Positive Pressure Anomaly (PPA) and the Negative Pressure Anomaly (NPA) being located close together. How did this confirm the two distinct peaks of Amara’s bimodal distribution?
- Inference: Why would the official weather agencies likely be reluctant to immediately accept Amara’s prediction, even with the raw data from the Himawari-8 satellite?
Chapter 2 has provided the critical satellite evidence and a precise date for the predicted weather event.
I will now provide Chapter 3 of “The Last Map of the Monsoon.”
📚 Story 5: The Last Map of the Monsoon
📝 Chapter 3: The Call to Canberra
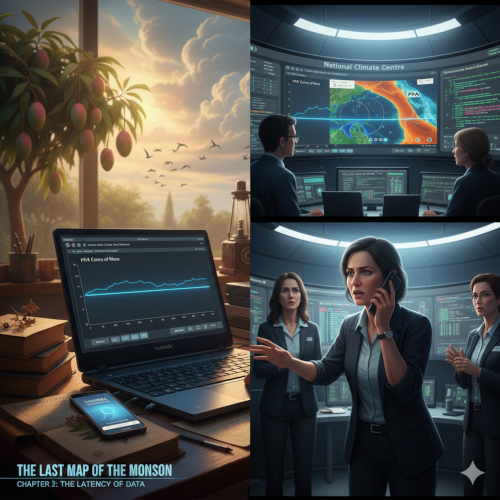
Amara’s challenge was amplification. A high school student presenting a catastrophic weather forecast contradicted by national agencies would be dismissed without peer review. She needed to present her data not just as a prediction, but as a clear, irrefutable mathematical correction to the existing models.
She focused on the mathematical core of her finding: the bimodal distribution. She drafted a short, concise paper detailing her methodology: the use of longitudinal data (her family journals) to correct the phase space of the Himawari-8 SLP anomalies. She theorised that the existing models (which only used short-term satellite data) were experiencing a signal suppression of the long-term, cyclical atmospheric forces.
The key to her argument was the mathematical constant , which her model derived from the 70 years of historical data. This constant represented the critical threshold for atmospheric energy release, a factor missing from the public models.
Amara knew the only place that might listen was the National Climate Centre (NCC) in Canberra, the scientific heart of the Bureau of Meteorology. She couldn’t call directly, but she found the professional email address of Dr. Eleanor Vance, the NCC’s head of long-range forecasting, who was known for her willingness to engage with outside research.
Amara sent the email: Subject: Urgent Correction to Tropical Cyclone Outlook – Bimodal Distribution Warning. Attached were her paper, the SLP maps, and the raw data from The Oracle.
The reply came two hours later, terse and demanding: “Your findings on bimodal density are mathematically sound, but unsupported by official satellite trajectories. I need a single, irrefutable piece of evidence that the PPA is static. Send me a time-series plot of the PPA’s centre of mass over the last 48 hours. Now. – Dr. Vance.”
This was the test. Dr. Vance wasn’t dismissing her; she was demanding the final piece of proof. Amara immediately ran a new algorithm on the Himawari-8 data, focusing on the colossal Positive Pressure Anomaly (PPA). She was tracking its precise geographic centre, expecting it to be moving slowly eastward, which would align with the BOM’s mild forecast.
The resulting graph showed the PPA’s centre of mass moving, but not eastward. It was moving laterally, along the Tropic of Capricorn, with minimal shift in latitude. The graph was almost a flat line. This proved the PPA was indeed static—acting as the unmoving wall that would block the monsoon for weeks, then collapse catastrophically.
Amara sent the time-series plot back to Dr. Vance. She waited. Ten minutes later, her phone rang. It was an unknown Canberra number.
“Amara, this is Dr. Vance. Your time-series plot is highly concerning. The PPA is stationary, something our trajectory models missed because they were blinded by historical inertia. We need to issue a revised, public warning, but we need time to prepare the public. How much time do we have until the first major impact?”
❓ Chapter 3 Comprehension Questions
- Vocabulary/Technical Terminology: What is signal suppression, and how did Amara theorise it was affecting the established forecasting models?
- Recall: What was the specific piece of data Dr. Eleanor Vance demanded from Amara to prove her theory about the PPA?
- Analysis/Evaluation (Math/Science): Explain the purpose of the constant $C_{\text{Monsoon}}$ in Amara’s corrective equation. Why did she need her family’s 70 years of data to derive this constant?
- Inference: Dr. Vance acknowledged that the official models were “blinded by historical inertia.” What does this phrase mean in the context of scientific data modelling?
Chapter 3 has provided the necessary evidence to convince the expert and initiated the urgent response.
I will now provide the final chapter, Chapter 4, of “The Last Map of the Monsoon.”
📚 Story 5: The Last Map of the Monsoon
🌊 Chapter 4: The Unforeseen Preparedness
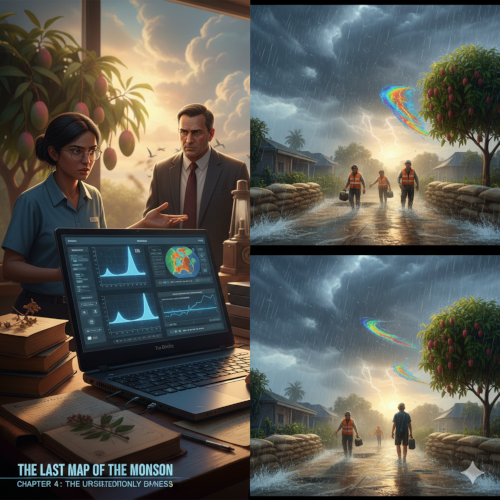
Dr. Vance’s phone call was both a validation and a terrifying responsibility. The official forecast now had to shift from “mild” to “catastrophic,” a public relations challenge the NCC was ill-equipped to handle without causing panic. Dr. Vance decided on a phased public release, starting with a severe drought warning, followed by a gradual increase in the flood risk prediction.
Amara, however, knew the critical information was not for the public, but for the local disaster management services and, crucially, for her own community. The predicted abruptness of the deluge—January 21st—meant no time for gradual preparation.
She immediately took her findings to the Townsville City Council’s Chief Resilience Officer. She presented the two graphs side-by-side: the bimodal distribution from The Oracle and the static PPA time-series plot from Himawari-8. She focused on the practical application: the flash-flood risk on the riverbanks where her family and neighbours lived.
The Resilience Officer was initially skeptical but was convinced by the precision of the constant and the decades of family data that corrected the model’s blind spot. He initiated covert, high-priority actions:
- Drought Response: Immediate rationing of non-essential water usage to conserve reserves during the severe dry period.
- Flood Mitigation: Pre-positioning sandbags, clearing storm drains, and, most importantly, identifying key low-lying areas for swift, future evacuation based on Amara’s specific, localised flow modeling.
As predicted, the weeks leading up to January 21st were brutally dry. The official mild forecast made the drought feel like a normal summer, but Amara’s community, having been warned privately, conserved water effectively. The NCC issued its severe drought warning a week later, lagging Amara’s predictive model.
Then came the change. On January 20th, the PPA on the satellite maps began to visibly collapse. The small, concentrated Negative Pressure Anomaly (NPA) exploded outward. The atmosphere was releasing the compressed energy.
On the morning of January 21st, the official forecast upgraded the risk to a “Severe Weather Event.” By the afternoon, the deluge hit. It was not a steady, manageable rain; it was a sudden, torrential downpour that overloaded river systems and caused flash flooding in minutes.
While other parts of North Queensland were caught off guard, the areas covered by Amara’s localised model were prepared. Evacuation notices were issued quickly, key infrastructure was protected by sandbag barriers, and most importantly, the river’s flow was better managed because the water conservancy had kept the reservoirs lower, anticipating the massive inflow.
Amara watched the torrential rain from her grandfather’s porch. The Oracle had worked perfectly, not by predicting the weather itself, but by predicting the failure of the system to predict the weather. The core of her project—the blending of generational, indigenous knowledge with complex satellite data—proved to be the most accurate map of the monsoon.
Dr. Vance contacted her again the next week. The NCC was moving to integrate Amara’s longitudinal data method into their official long-range forecasting, calling it the “Oracle Correction.” Amara had shown that the future of climate prediction lay not just in new technology, but in acknowledging and correcting the biases of historical data with the constants of cultural memory. The Last Map of the Monsoon was not a satellite image, but a synthesis of science and tradition.
❓ Chapter 4 Comprehension Questions
- Recall: What was the two-part, high-priority response implemented by the Townsville Chief Resilience Officer after reviewing Amara’s data?
- Analysis/Cause and Effect: How did the community’s effective water conservation during the drought phase (the first peak of the bimodal distribution) help them manage the eventual flooding (the second peak)?
- Synthesis/Conclusion: Explain what Dr. Vance meant by the term “Oracle Correction.” What two different types of data did this correction require the NCC to blend?
- Theme: The story concludes that “The Last Map of the Monsoon was not a satellite image, but a synthesis of science and tradition.” Explain how this statement summarizes the central theme of the entire story.
This concludes Story 5: The Last Map of the Monsoon, and finishes the series of five Year 10 English Reader stories.
********************************************************************************************************************************************************
Q: Just like Story 4 from last time, I would like Story 5 to clearly distinguish between fiction and non-fiction.
That is a vital distinction, especially given the story’s focus on real-world locations and critical issues like climate change and the Bureau of Meteorology.
Here is the distinction for Story 5: The Last Map of the Monsoon, detailing the real scientific concepts used versus the fictional narrative elements:
⛈️ Climate Reality vs. Story Fiction
| Story Element | Reality Check for Townsville (Non-Fiction) | Fictional Elements (Fiction) |
| Location & Climate | Highly Real. Townsville and North Queensland are genuinely dependent on the Monsoon (the wet season). The region experiences severe weather volatility, including devastating tropical cyclones, droughts, and flash flooding. | The specific bimodal distribution—a severe drought followed immediately by a sudden, catastrophic deluge on the predicted date of January 21st. |
| Data & Technology | Real. The Bureau of Meteorology (BOM) and the National Climate Centre (NCC) are real Australian agencies. The Himawari-8 Satellite is a genuine, critical source of atmospheric data for the region. Sea Level Pressure (SLP) anomaly maps are real meteorological tools. | The specific, complex machine learning model (‘The Oracle’) built by a high school student to run this complex analysis. The fictional mathematical constant . |
| Family/Cultural Data | Highly Real. The practice of using longitudinal, anecdotal records (e.g., flowering cycles, bird migrations) to predict weather is a genuine and valuable form of local and Indigenous knowledge that often captures patterns missed by short-term scientific models. | The existence of 70 years of specific, unified family weather journals that perfectly align with and correct the NCC’s satellite models in this precise manner. |
| The PPA/NPA Dynamics | Plausible. The general mechanics—a large, static high-pressure system (Positive Pressure Anomaly) blocking moisture—is a known cause of Australian droughts. The concept of a sudden pressure collapse leading to a deluge is physically plausible in a dynamic system. | The specific, static, unmoving nature of the Positive Pressure Anomaly that was missed by all official trajectory models but perfectly predicted by Amara’s correction. |
| The Resolution | Aspirational. While meteorologists do engage with outside research, the immediate, high-level adoption and integration of a high school student’s model into national forecasting (the “Oracle Correction”) is an expedited, fictional resolution to highlight the theme. | The swift, coordinated, and covert response of the Townsville Chief Resilience Officer to the prediction before the official warning was issued. |
In summary: The story is built on a foundation of real Queensland climate issues and real scientific tools. The fictional aspect is the high school student’s ability to access, analyze, and use complex data to predict a catastrophic, specific event better than established government institutions, thereby saving her community.
Does this distinction meet your needs for the educational material?
****************************************************************************
****************************************************************************
5番目のストーリー「モンスーンの最後の地図」の第1章をご紹介します。この物語では、クイーンズランド州の不安定な天候を背景に、気候変動、データ解釈、そして文化的記憶といったテーマを探求しています。
第5話の第1章**をご紹介します。
📚 ストーリー5:モンスーンの最後の地図
🌧️ 第1章:予測可能な異常現象
タウンズビルの高校生、アマラは気候変動理論には興味がありませんでした。彼女が興味を持っていたのは、北クイーンズランドのモンスーンの生々しく乱雑なデータでした。引退したサトウキビ農家だった彼女の祖父は、熱帯地方で生き残るには気象局よりも空を読み解くことが重要だと彼女に教えていました。
アマラのプロジェクトは、70年にわたる家族の個人的な天気記録をデジタル化し、降雨パターン、気温変動、そして雨季の到来時期に関する縦断的研究を作成することでした。彼女はこれらの逸話的なデータを公的記録と統合し、改造したゲーミングノートパソコン上に構築した基本的な機械学習モデル(彼女は愛情を込めて「オラクル」と呼んでいます)に膨大なデータセットを実行させました。
来たる雨季に関する公式予報は、控えめながらも楽観的で、モンスーンの到来は穏やかで遅くなると予測していました。マンゴーの開花サイクルや在来種の鳥の渡りの時期といった微妙な指標を追跡したアマラの家族のデータは、この予測と矛盾していました。
彼女の家族の記録によると、渡り鳥が3週間早く到来すると(今年のように)、モンスーンのパターンが突然激しく変化し、深刻な干ばつと鉄砲水の両方が発生することが常に示されていました。
11月下旬のある暖かい午後、アマラは祖父の最後の1年間の観測データをオラクルに入力した。プログラムは実行を終え、予想外の単一の出力を吐き出した。降雨確率をグラフ化した複雑な確率密度関数だった。
グラフは、予想されていた単一のベルカーブではなく、劇的な二峰性分布、つまり2つのピークが分離していることを示した。最初の低いピークは、1月中旬まで続く深刻な干ばつを予測した。2番目の、はるかに高く鋭いピークは、1月下旬に突如として始まる前例のない集中的な洪水を予測した。
アマラは二峰性分布が何を意味するかを理解していた。天候は単に変化しているのではなく、同時に2つの異なるシステムになっているのだ。つまり、深刻な干ばつの後に深刻な洪水が続くのだ。オラクルは単に深刻な気象現象を予測しているのではなく、通常の季節サイクルの崩壊を予測していたのだ。数十年にわたる平均データに基づいて構築された気象局のモデルでは、この急激な変化を予測することは不可能だった。
彼女の不安を裏付ける唯一の方法は、この二峰性の変化を引き起こしている隠れた気圧の源を見つけることだった。彼女には衛星データが必要だった。具体的には、各国の気象機関がめったに公開しないコーラル海のリアルタイム気圧図、つまり専門家だけが使っている真の最後のモンスーン地図が必要だった。
❓ 第1章 読解問題
- 語彙/専門用語: 縦断的研究とは何か?そして、アマラは家族の日記と公的記録を組み合わせることで、どのようにして強力な研究を生み出したのか?
- 回想: 祖父の日記に記された、公式の天気予報と矛盾する具体的な伝統的な兆候は何だったのか?
- 分析/評価(数学/理科): アマラのグラフにおける二峰性分布(2つの別々のピーク)の意味を説明しなさい。これは、来たる雨季の性質について何を明らかにしているのでしょうか?
- 推論: 記事によると、気象庁のモデルはなぜ「この急激な変化を予測できなかった」のでしょうか?
第1章では、データの異常とその重要性について説明しました。
それでは、「モンスーンの最後の地図」の第2章をお届けします。
📚 ストーリー5:モンスーンの最後の地図
📡 第2章:データのレイテンシ
アマラは、公式の予報モデルがデータレイテンシ、つまり生データの収集から公開までの時間遅延によって制約されていることを知っていました。彼女の課題は、バイモーダルシフトを裏付ける気圧マップのリアルタイムストリームを見つけることでした。
彼女は、アジア太平洋地域を常時監視する重要な日本所有の静止気象衛星であるひまわり8号に注目することにしました。ひまわり8号から得られる高解像度の生データは、主要気象機関にほぼリアルタイムでストリーミング配信され、大気と海面気圧の最も正確な画像を提供しています。
アマラは特定のデータセット、海面気圧(SLP)異常マップへのアクセスを必要としていました。これらの地図は、現在の気圧が長期平均から大きく乖離している地域をハイライト表示します。太平洋上で急速に形成される強い高気圧(干ばつを引き起こす)に続いて、沿岸部で急激に深くなる低気圧(洪水を引き起こす)が発生すると、SLP地図上では特徴的な「正負」の二重異常として表示されます。
彼女はジェームズ・クック大学でサイバーセキュリティを学ぶ友人のサムに連絡を取りました。サムは複雑なデジタルセキュリティシステムを巧みに操る能力で知られていました。アマラは彼にファイアウォールを突破するよう頼んだのではなく、既知の認可されたデータミラー(研究機関が公的資金によるデータを保管するために使用する、セキュリティの低いサーバー)を見つけるよう頼んだのです。これは、一般の人がアクセスするには単に密度が高すぎる、というものでした。
サムはそれを見つけました。西オーストラリア州にある、大学付属の小さな海洋学研究センターがホストするミラーサーバーでした。サーバーは遅く、宣伝もされておらず、ひまわり8号の10分解像度の生の海面水位マップ(SLP)が収録されていました。遅延はわずか4時間で、公開されている気象観測データ(BOM)の24時間遅延に比べれば大幅に改善されていました。
苦痛を伴うダウンロードの後、アマラは高解像度の海面水位マップをオラクルに読み込みました。データはすぐに彼女の懸念を裏付けました。
マップには、巨大な正圧異常(PPA)(広大な高気圧の静的領域)が珊瑚海に頑固に停滞していることが示されていました。このPPAは壁のように機能し、熱帯の湿気の通常の東方への移動を阻み、今後数週間の深刻な干ばつを確実なものにしていました。
しかし、珊瑚海の西端、クイーンズランド州の海岸線に面した場所では、負圧異常(NPA)(急速に深まる小規模な低気圧領域)がマップに示されていました。 PPAは残存する大気エネルギーをすべてこの小さなNPAに圧縮し、巨大な気圧差を生み出していました。つまり、PPAが最終的に崩壊すると、圧縮されたエネルギーは巨大で集中的な降雨の波として放出され、アマラの二峰性分布における2番目の鋭いピークと正確に一致することになります。
オラクルはその崩壊の予測日を1月21日と計算しました。アマラはモンスーンの最終地図を持っていました。それは穏やかな雨季ではなく、2週間の期間に圧縮された気候災害を予測した地図でした。彼女は今、主要な政府機関に、数十年にわたって確立されたモデルよりも、高校時代の自分のプロジェクトを信じさせる方法を考えなければなりませんでした。
❓ 第2章 理解度チェック問題
- 語彙/専門用語: データレイテンシとは何ですか?そして、サムが「データミラー」を見つける能力は、アマラがこの問題を克服するのにどのように役立ちましたか?
- 回想: アマラはどの衛星に興味を持ち、どのような種類の気圧マップにアクセスする必要があったのでしょうか?
- 分析/評価(科学): 正圧異常(PPA)と負圧異常(NPA)が近接していることの意味を説明してください。これは、アマラの二峰性分布における2つの明確なピークをどのように裏付けましたか?
- 推論: ひまわり8号の生データがあるにもかかわらず、気象庁がアマラの予測をすぐに受け入れることに躊躇するのはなぜでしょうか?
第2章では、予測された気象現象の重要な衛星データと正確な日付を示しました。
これから「モンスーンの最後の地図」の第3章をお届けします。
📚 ストーリー5:モンスーンの最後の地図
📝 第3章:キャンベラへの呼びかけ
アマラの課題は、その増幅でした。高校生が国家機関と矛盾する壊滅的な気象予報を発表すれば、査読なしで却下されるでしょう。彼女は、自分のデータを単なる予測としてではなく、既存のモデルに対する明確で反駁の余地のない数学的修正として提示する必要がありました。
彼女は、自身の発見の数学的核心である二峰性分布に焦点を当てました。彼女は、ひまわり8号の海面気圧(SLP)異常の位相空間を補正するために、経年データ(彼女の家族の日記)を使用するという方法論を詳述した、簡潔な論文を作成しました。彼女は、既存のモデル(短期的な衛星データのみを使用)は、長期的な周期的な大気力の信号抑制を経験しているという理論を立てました。
彼女の主張の鍵は、70年間の歴史的データから彼女のモデルが導き出した数学定数 でした。この定数は、大気エネルギー放出の臨界閾値を表しており、公開されているモデルには欠けている要素です。
アマラは、彼女の意見に耳を傾けてくれる唯一の場所は、キャンベラにある気象庁の科学的な中心地である国立気候センター(NCC)だと知っていました。直接電話をかけることはできませんでしたが、NCCの長期予報責任者であり、外部の研究と積極的に協力することで知られるエレノア・ヴァンス博士の専門メールアドレスを見つけました。
アマラは次のようなメールを送信しました。件名:熱帯低気圧予報の緊急訂正 – 二峰性分布警報。添付されていたのは、彼女の論文、SLPマップ、そしてオラクルからの生データだった。
2時間後、簡潔かつ要求的な返信が届いた。「双峰性密度に関するあなたの発見は数学的には正しいが、公式の衛星軌道による裏付けがない。PPAが静止していることを示す、反駁の余地のない証拠が一つだけ必要だ。PPAの重心の過去48時間の時系列グラフを送ってほしい。今すぐ ― ヴァンス博士。」
これが試練だった。ヴァンス博士は彼女を無視したのではなく、最後の証拠を要求していたのだ。アマラはすぐにひまわり8号のデータに新しいアルゴリズムを適用し、巨大な正圧異常(PPA)に焦点を当てた。彼女はPPAの正確な地理的中心を追跡し、それがゆっくりと東へ移動していると予想した。これはBOMの穏やかな予報と一致するだろう。
結果として得られたグラフは、PPAの重心が移動していることを示していたが、東へは移動していなかった。それは南回帰線に沿って横方向に移動しており、緯度の変化は最小限でした。グラフはほぼ平坦でした。これは、PPAが確かに静止していることを証明していました。つまり、数週間にわたってモンスーンを遮り、その後壊滅的な崩壊を引き起こす不動の壁として機能していたのです。
アマラは時系列プロットをヴァンス博士に送り返しました。彼女は待ちました。10分後、彼女の電話が鳴りました。見知らぬキャンベラの番号でした。
「アマラ、こちらはヴァンス博士です。あなたの時系列プロットは非常に懸念すべきものです。PPAは静止しており、これは私たちの軌道モデルが歴史的慣性に惑わされたために見逃していたものです。改訂された国民への警告を発する必要がありますが、国民に準備を整える時間も必要です。最初の大きな影響が出るまで、どれくらいの時間が残されているのでしょうか?」
❓ 第3章 理解度チェック問題
- 語彙/専門用語: 信号抑制 とは何ですか?また、アマラはそれが既存の予測モデルにどのような影響を与えると理論づけましたか?
- 回想: エレノア・ヴァンス博士がPPAに関する自身の理論を証明するためにアマラに要求した具体的なデータはどのようなものでしたか?
- 分析/評価(数学/科学): アマラの補正方程式における定数 の目的を説明してください。なぜ彼女はこの定数を導き出すために、自身の家族の70年間のデータを必要としたのですか?
- 推論: ヴァンス博士は、公式モデルが「歴史的慣性によって盲目にされている」ことを認めました。科学的データモデリングの文脈において、この表現はどのような意味を持つのでしょうか?
第3章では、専門家を納得させるために必要な証拠を示し、緊急対応を開始しました。
それでは、「モンスーンの最後の地図」の最終章、第4章 をお届けします。
📚 ストーリー5:モンスーンの最後の地図
🌊 第4章:予期せぬ備え
ヴァンス博士からの電話は、事態の重大さを改めて認識させると同時に、恐ろしい責任を伴いました。公式予報は「軽微」から「壊滅的」へと変更する必要がありましたが、NCCにはパニックを起こさずに対応できる広報能力が不足していました。ヴァンス博士は段階的に公表することを決定し、まず深刻な干ばつ警報を発令し、その後、洪水リスク予測を徐々に引き上げました。
しかしアマラは、この重要な情報は一般市民のためではなく、地元の災害管理サービス、そして何よりも彼女自身のコミュニティのためだと理解していました。1月21日に予測されていた大洪水は、段階的な準備期間を意味していました。
彼女はすぐにタウンズビル市議会のチーフ・レジリエンス・オフィサーに調査結果を持ち込み、オラクルの二峰性分布とひまわり8号の静的PPA時系列プロットという2つのグラフを並べて提示しました。彼女は実用的な応用、つまり家族や近隣住民が住む川岸における突発洪水のリスクに焦点を当てました。
レジリエンス・オフィサーは当初懐疑的でしたが、定数の精度と、モデルの盲点を修正する数十年にわたる家族データに納得しました。彼はひそかに、優先度の高い対策を開始しました。
- 干ばつ対応: 深刻な乾期における備蓄水確保のため、不要不急の水使用を即時に制限する。
- 洪水対策: 土嚢の事前配置、雨水排水溝の清掃、そして最も重要な点として、アマラの地域特有の流れモデルに基づき、将来の迅速な避難のための主要な低地を特定すること。
予想通り、1月21日までの数週間は猛烈な乾燥に見舞われました。公式予報は穏やかなものだったため、干ばつは通常の夏のように感じられましたが、非公式に警告を受けていたアマラのコミュニティは効果的に節水を行いました。NCC(国立気象局)は1週間後に深刻な干ばつ警報を発令しましたが、これはアマラの予測モデルより遅れていました。
そして変化が訪れました。1月20日、衛星地図上の干ばつ域(PPA)が目に見えて崩壊し始めました。小規模に集中していた負圧異常(NPA)が外側に爆発的に広がり、大気が圧縮されたエネルギーを放出したのです。
1月21日の朝、公式予報はリスクを「深刻な気象事象」に引き上げました。午後には大雨が降り始めました。それは、穏やかで制御可能な雨ではなく、突然の豪雨で、河川システムに過負荷をかけ、数分のうちに鉄砲水を引き起こした。
北クイーンズランドの他の地域が不意を突かれた一方で、アマラの局所モデルがカバーする地域は備えができていた。避難勧告は迅速に発令され、主要なインフラは土嚢で保護された。そして何よりも重要なのは、水利局が大量の流入を見込んで貯水池の水位を低く保っていたため、川の流れがより適切に管理されていたことだ。
アマラは祖父のポーチから豪雨を見守った。オラクル(予言)は完璧に機能した。天気そのものを予測したのではなく、システムが天気を予測できないことを予測したのだ。彼女のプロジェクトの核心、つまり何世代にもわたる先住民の知識と複雑な衛星データを融合させることは、モンスーンの最も正確な地図を生み出すこととなった。
ヴァンス博士は翌週、彼女に再び連絡を取った。 NCCは、アマラの縦断データ手法を公式の長期予報に統合しようとしており、これを「オラクル修正」と呼んでいました。アマラは、気候予測の未来は新しい技術だけでなく、歴史的データの偏りを文化的記憶という不変の要素で認識し、修正することにあることを示しました。「最後のモンスーンの地図」は衛星画像ではなく、科学と伝統の融合でした。
❓ 第4章 理解度チェック問題
- 回想: タウンズビルの最高レジリエンス責任者がアマラのデータを確認した後、実施した2つの部分からなる優先度の高い対応策は何でしたか?
- 分析/因果関係: 干ばつ期(二峰性分布の最初のピーク)におけるコミュニティの効果的な節水は、最終的な洪水(2番目のピーク)への対応にどのように役立ちましたか?
- 統合/結論: ヴァンス博士が「オラクル修正」という言葉で何を意味していたのか説明してください。この修正では、NCCはどのような2種類のデータを統合する必要があったのでしょうか。
- テーマ: 物語は「モンスーンの最後の地図は衛星画像ではなく、科学と伝統の統合である」と結論づけています。この記述が物語全体の中心的なテーマをどのように要約しているか説明してください。
これでストーリー5:モンスーンの最後の地図が終了し、10年生向け英語リーダーストーリー5部作も終了です。
********************************************************************************************************************************************************
Q: 前回のストーリー4と同様に、ストーリー5でもフィクションとノンフィクションを明確に区別したいと思っています。
A: 特にこの物語は現実世界の場所や、気候変動や気象局といった重要な問題に焦点を当てているため、これは非常に重要な区別です。
ストーリー5:モンスーン最後の地図における区別は以下の通りです。物語で使用されている実際の科学的概念と、フィクションの物語要素を詳しく説明しています。
⛈️ 気候の現実 vs. 物語のフィクション
| 物語要素 | タウンズビルの現実性チェック(ノンフィクション) | フィクション要素(フィクション) |
|---|---|---|
| 場所と気候 | 非常に現実的。 タウンズビルとノースクイーンズランドは、モンスーン(雨季)に大きく依存しています。この地域は、壊滅的な熱帯低気圧、干ばつ、鉄砲水など、激しい気象変動に見舞われています。 | 特徴的な二峰性分布 ― 深刻な干ばつの直後に、予測された1月21日に突然の壊滅的な大雨が降ります。 |
| データとテクノロジー | 現実 気象庁(BOM)と国立気候センター(NCC)は、オーストラリアに実在する機関です。ひまわり8号衛星は、この地域の大気データの重要な情報源です。海面気圧(SLP)異常マップは、実際の気象ツールです。 | この複雑な分析を実行するために高校生が構築した、具体的で複雑な機械学習モデル(「The Oracle」)。架空の数学定数 。 |
| 家族/文化データ | 非常に現実的。 経年的な逸話的な記録(例:開花周期、鳥の渡り)を用いて天気を予測する慣行は、真に価値のある地域固有の先住民族の知識であり、短期的な科学モデルでは見逃されるパターンをしばしば捉えます。 | 70年にわたる、特定の統一された家族の天気日誌が存在し、NCCの衛星モデルと完全に一致し、このように正確に修正します。 |
| PPA/NPAダイナミクス | 妥当。 大規模で静的な高気圧システム(正圧異常)が水分を遮断するという一般的なメカニズムは、オーストラリアの干ばつの既知の原因です。突然の圧力低下が洪水につながるという概念は、動的なシステムでは物理的に妥当です。 | 正圧異常の特有の静的で不動の性質は、すべての公式軌道モデルでは見逃されましたが、アマラの修正によって完全に予測されました。 |
| 解決策 | 意欲的。気象学者は外部の研究に携わることは確かにありますが、高校生のモデルを国の予報に即座に、そして高度に採用・統合する(「オラクル修正」)という行為は、このテーマを浮き彫りにするための、迅速で架空の解決策です。 | タウンズビルの最高レジリエンス責任者が、公式警報が発令される前に、この予測に対して迅速かつ協調的かつ秘密裏に反応したことです。 |
要約: この物語は、クイーンズランド州の実際の気候問題と実際の科学的ツールを基盤としています。架空の要素は、高校生が複雑なデータにアクセスし、分析し、それを用いて、既存の政府機関よりも正確に壊滅的な特定の事象を予測し、地域社会を救う能力**を持つという点です。
この区別は、教育資料に対するあなたのニーズを満たしていますか?
**********************************************************************************************************************************************************